
Alarms tab
The Alarms tab shows the router’s alarm register: what is wrong now and since when, grouped by area. The router checks every minute. The tab’s badge shows how many alarms are active.
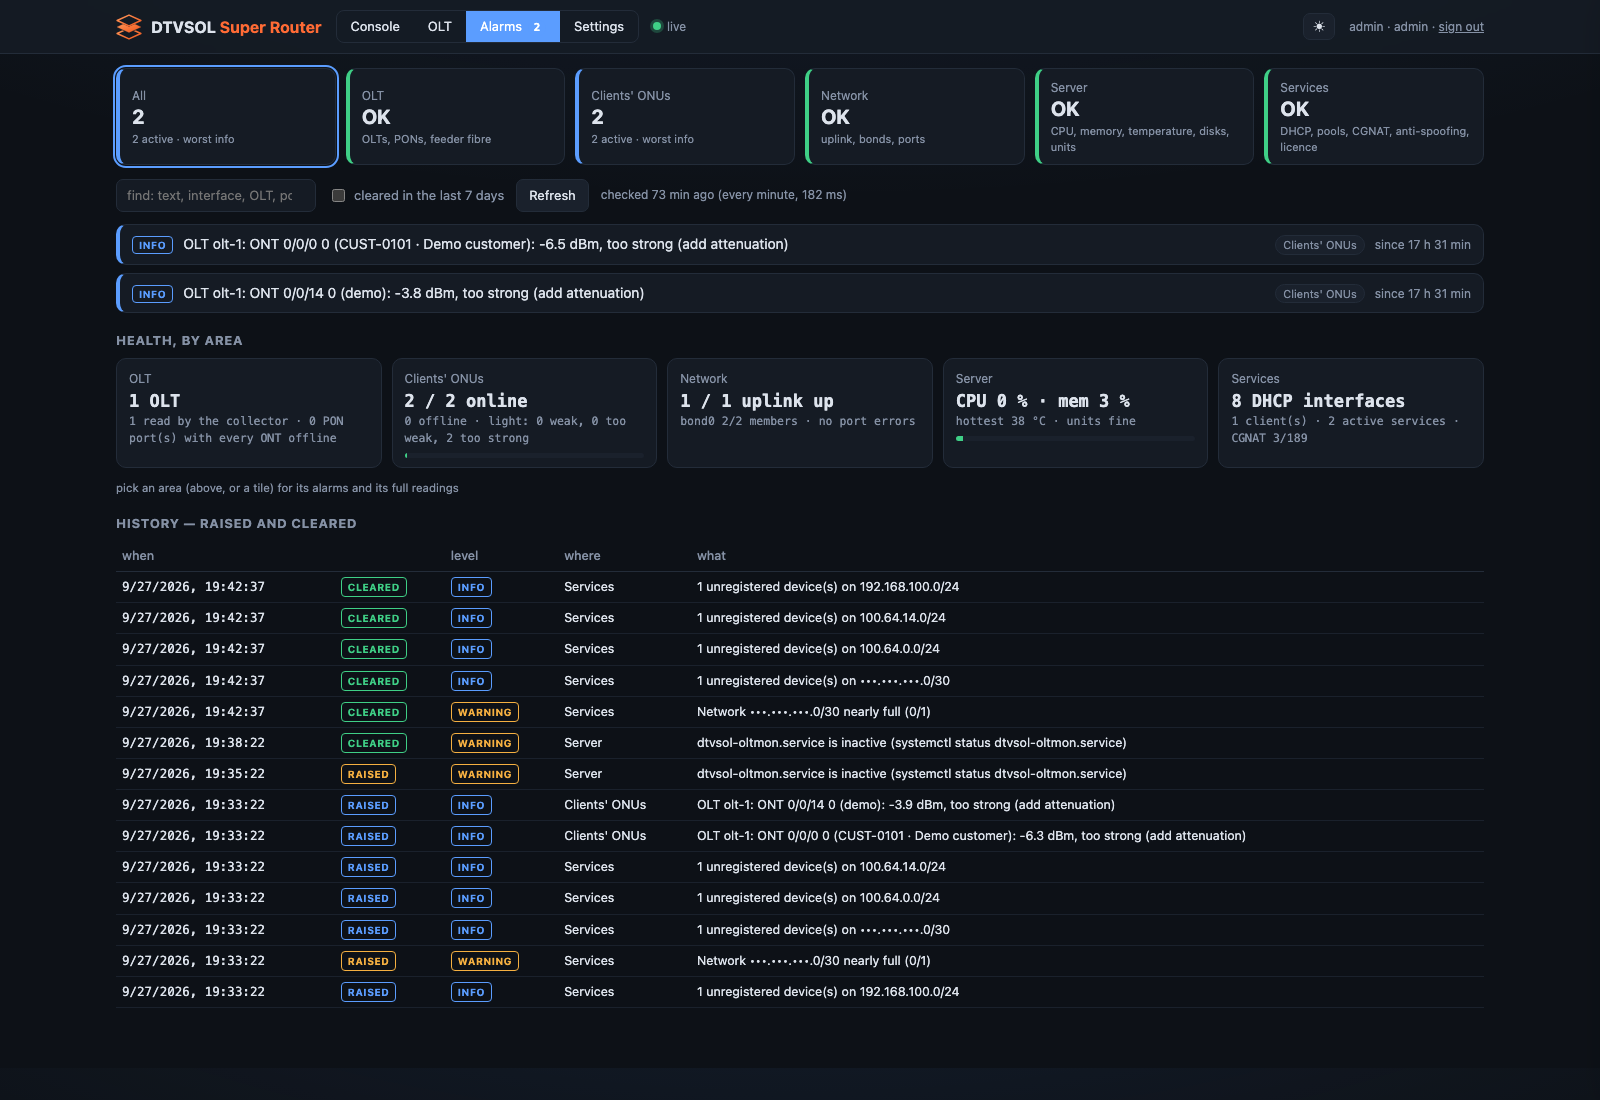
The area cards
Section titled “The area cards”Five cards at the top, one per area. Each shows its active alarms, coloured by the worst:
| Area | Covers |
|---|---|
| OLT | OLTs, PON ports, feeder fiber |
| Clients’ ONUs | light, line errors, ONTs gone |
| Network | uplink, bonds, ports |
| Server | CPU, memory, temperature, disks, units |
| Services | DHCP, pools, CGNAT, anti-spoofing, licence |
Click a card to show only that area. Click it again to show all.
The alarm list
Section titled “The alarm list”Each alarm shows its level (critical, warning or info), the text, its area and how long it has lasted. Click an alarm for its details.
- The search box finds alarms by text, interface, OLT, port or service.
- cleared in the last 7 days adds the alarms that are gone.
- Refresh reads the register now.
Health readings
Section titled “Health readings”Below the list, the health readings of the area you picked (or of every area):
- OLT: each OLT’s last collector run, PON ports, ONTs online, and ports with every ONT offline.
- Clients’ ONUs: ONTs online, why the others are offline, the light in bands, the weakest ONTs.
- Network: each port’s traffic, errors and overruns per minute, the bonds’ members and LACP state, the uplink and the default routes.
- Server: CPU (and the busiest core’s softirq), memory, temperatures, disks, the connection-tracking table, the router’s units.
- Services: DHCP, clients, services, CGNAT use, anti-spoofing.
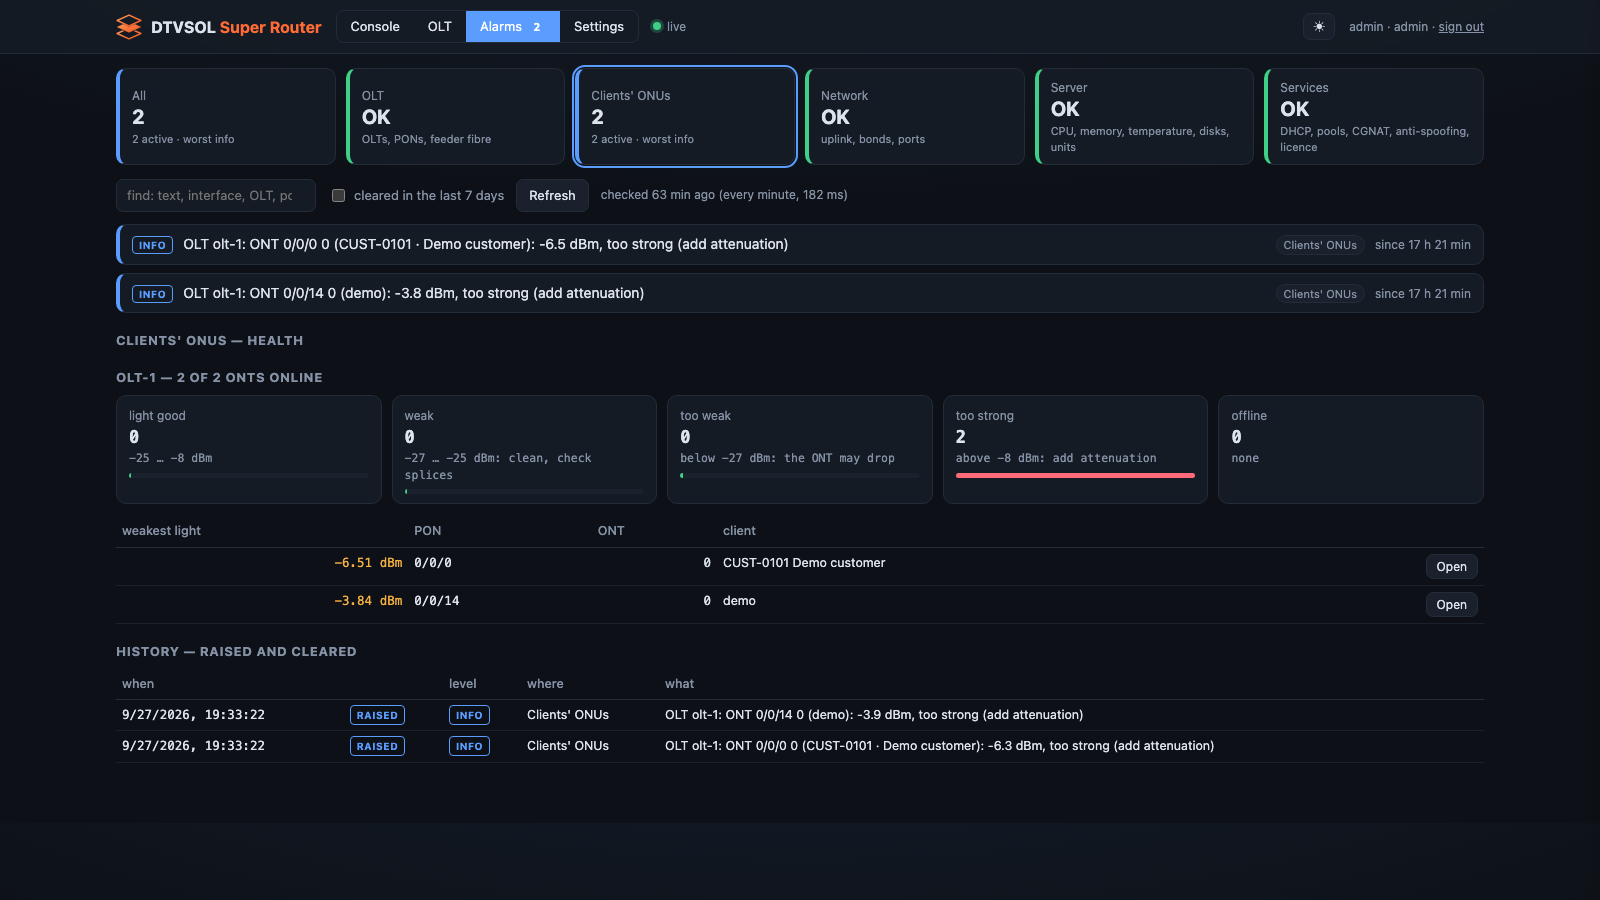
Everything here comes from what the router already keeps. Opening the tab does not ask an OLT.
History
Section titled “History”At the bottom, history — raised and cleared: the latest raises and clears, with time, level, area and text.
The same information is on the command line:
dtvsol alarmsdtvsol alarms alldtvsol alarms history 50This site was written with the help of AI and checked by our team.