See it working
The screens below are the real monitor with demo data from our lab. The API panel answers with recorded responses.
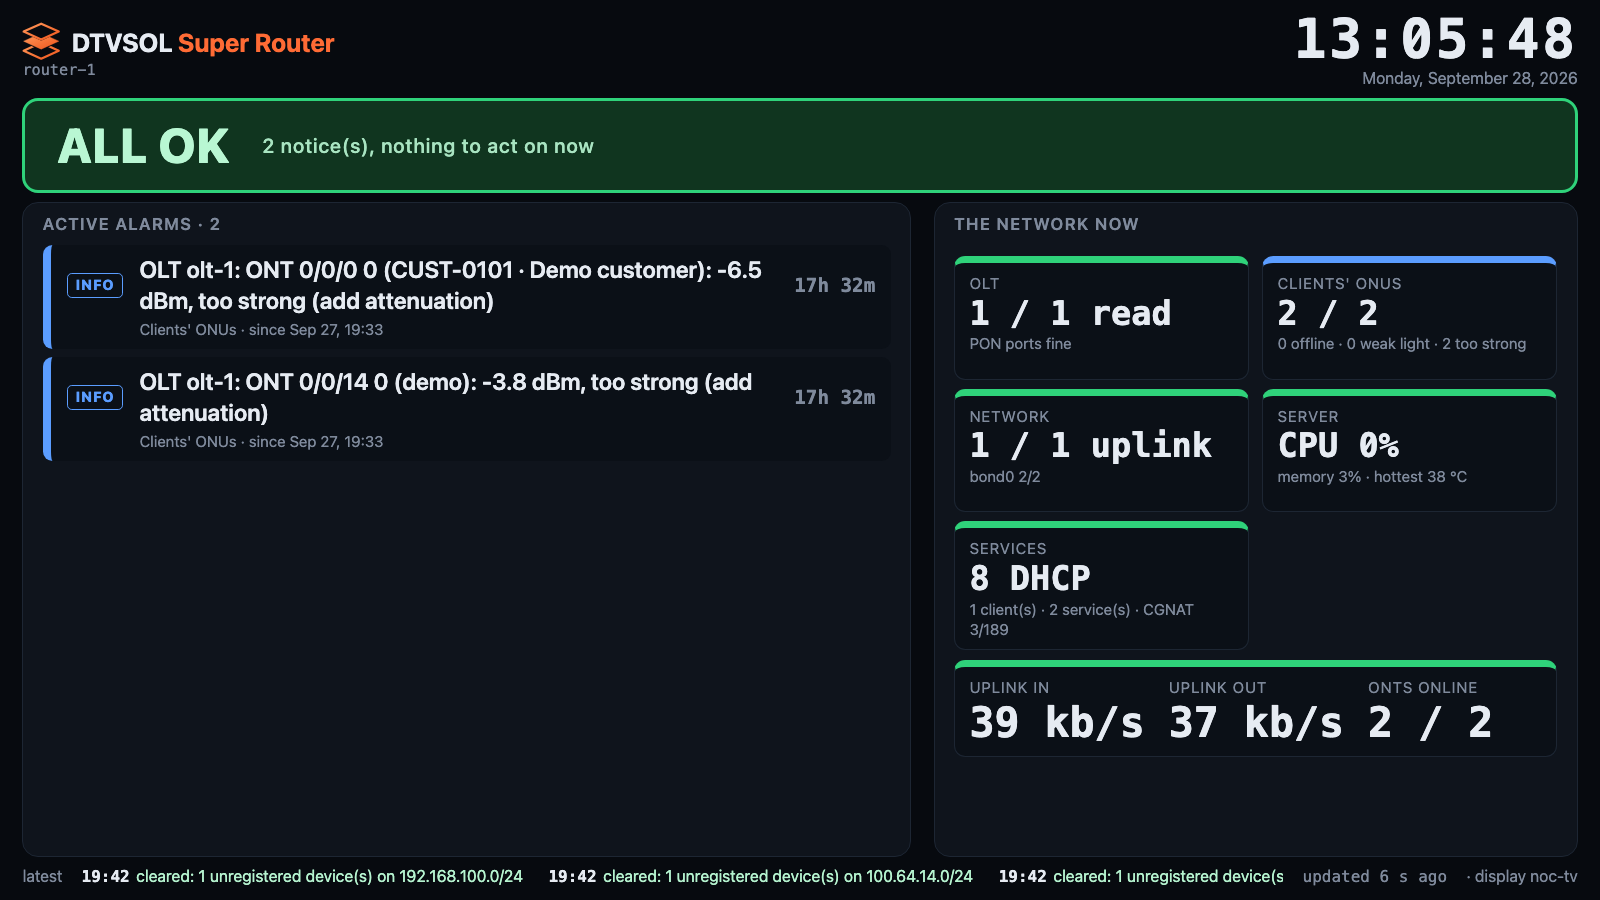
The 24/7 wall
For a TV in the support room: all OK in green…
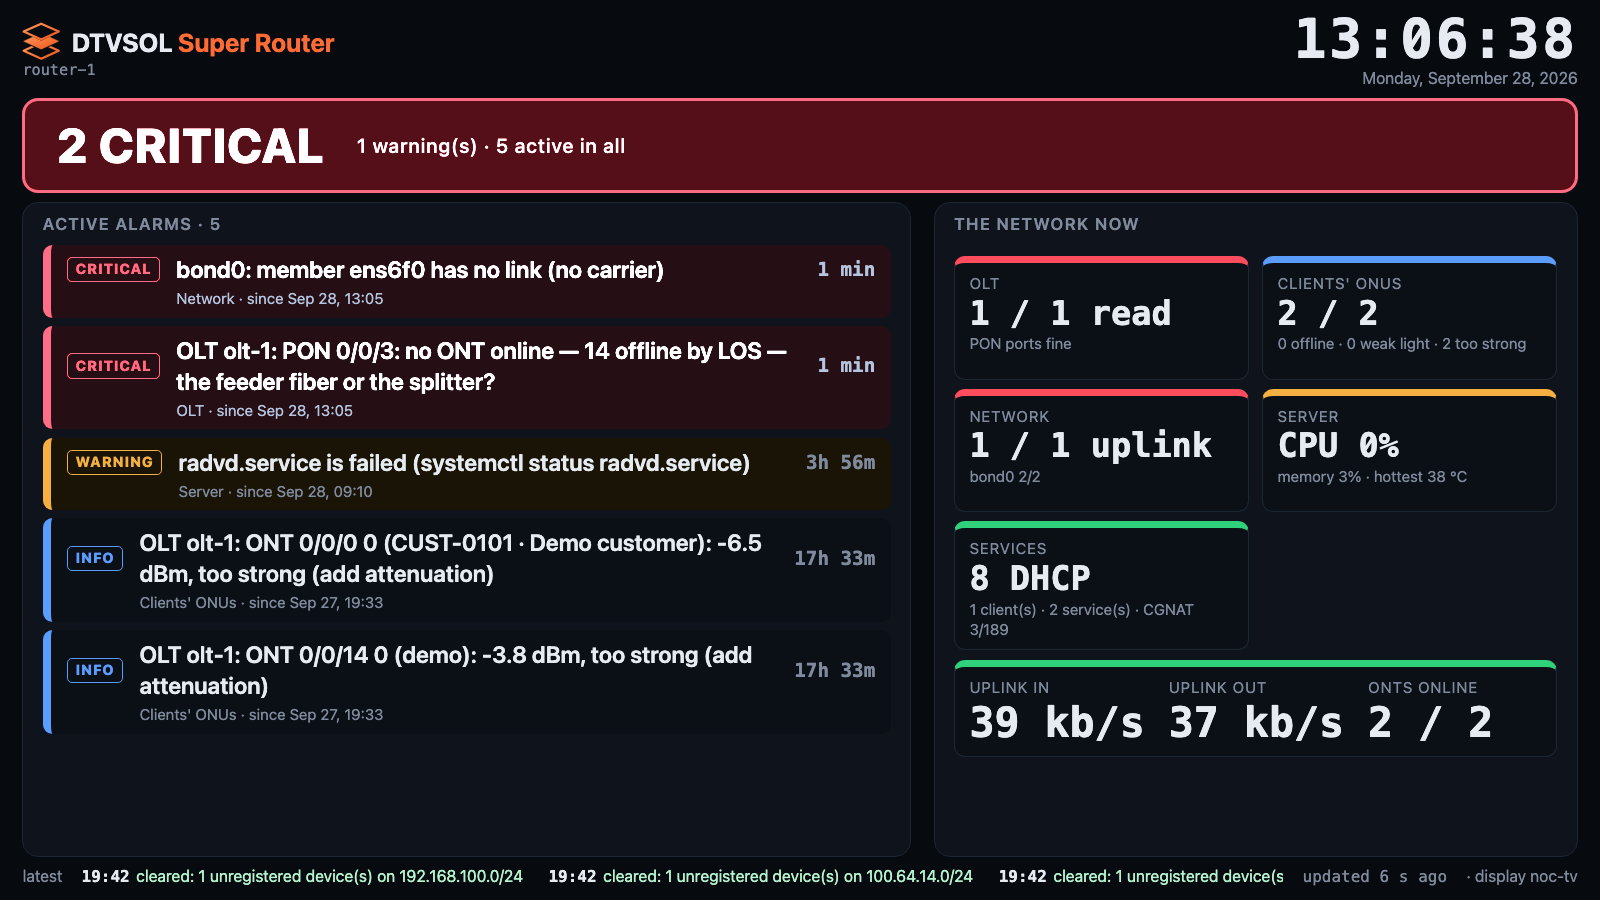
…and what is wrong, in red
Critical alarms pulse, the oldest first, with how long they have been open.
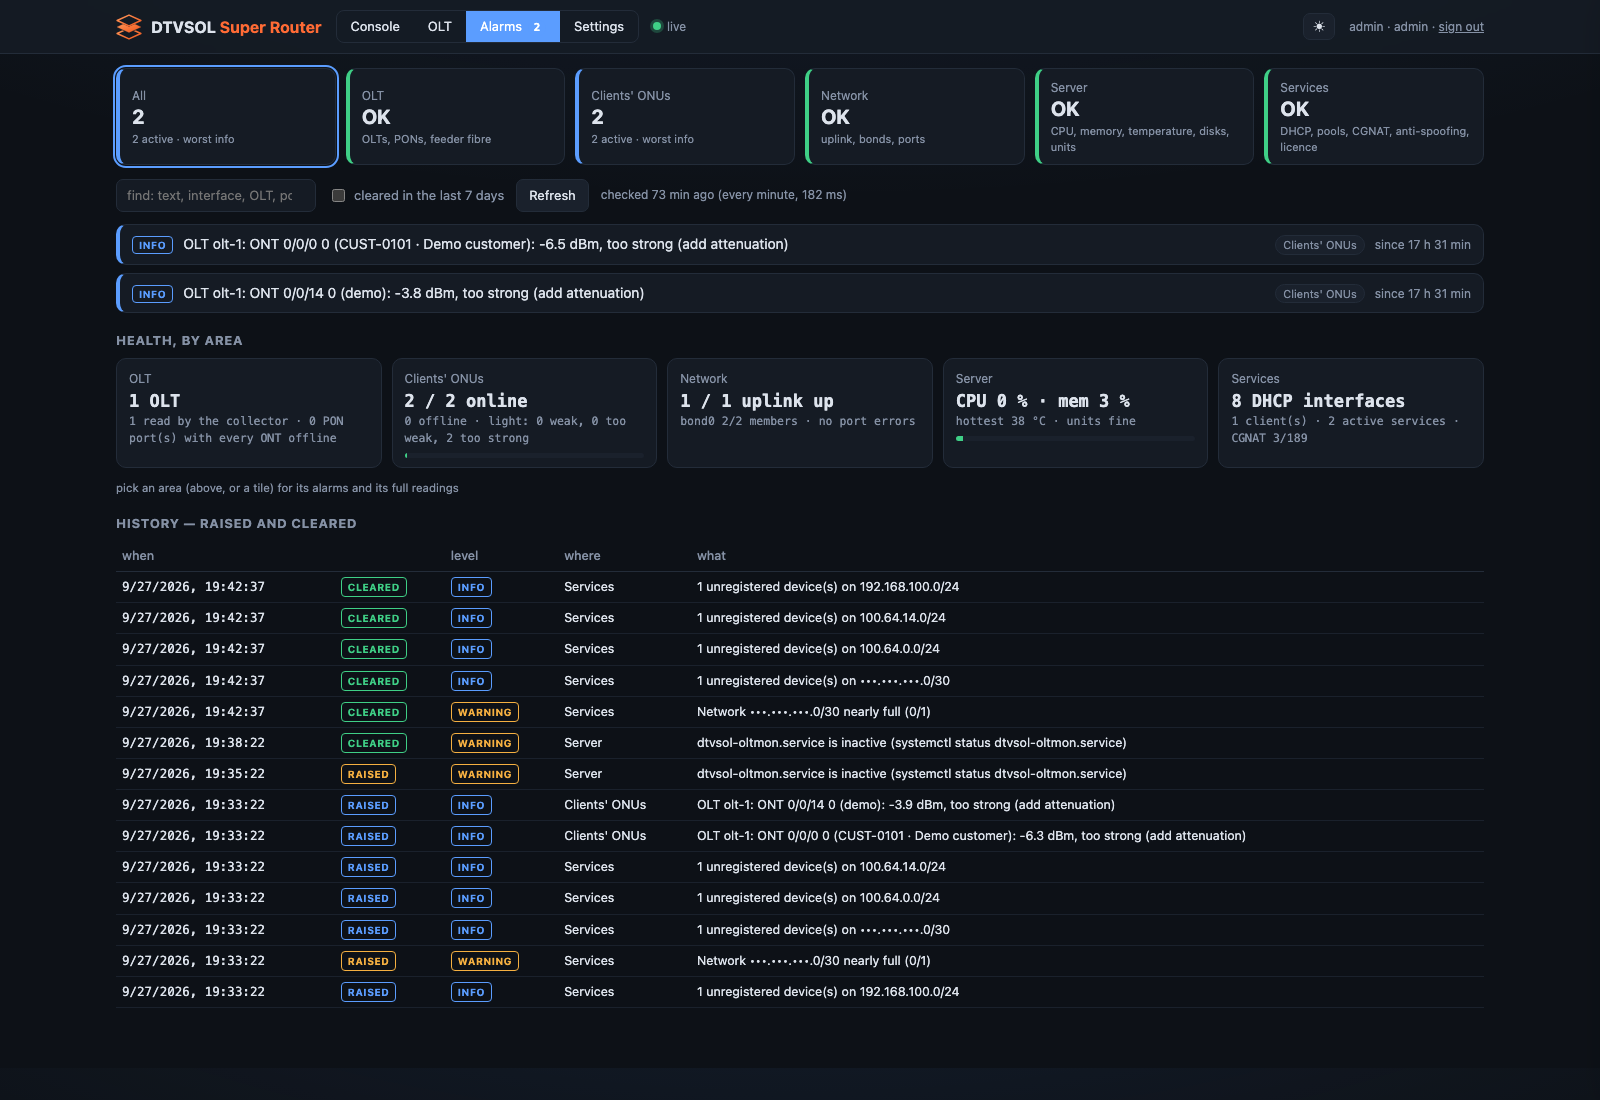
Alarms by area
OLT, clients’ ONUs, network, server and services — each checked every minute, with a history of raises and clears.
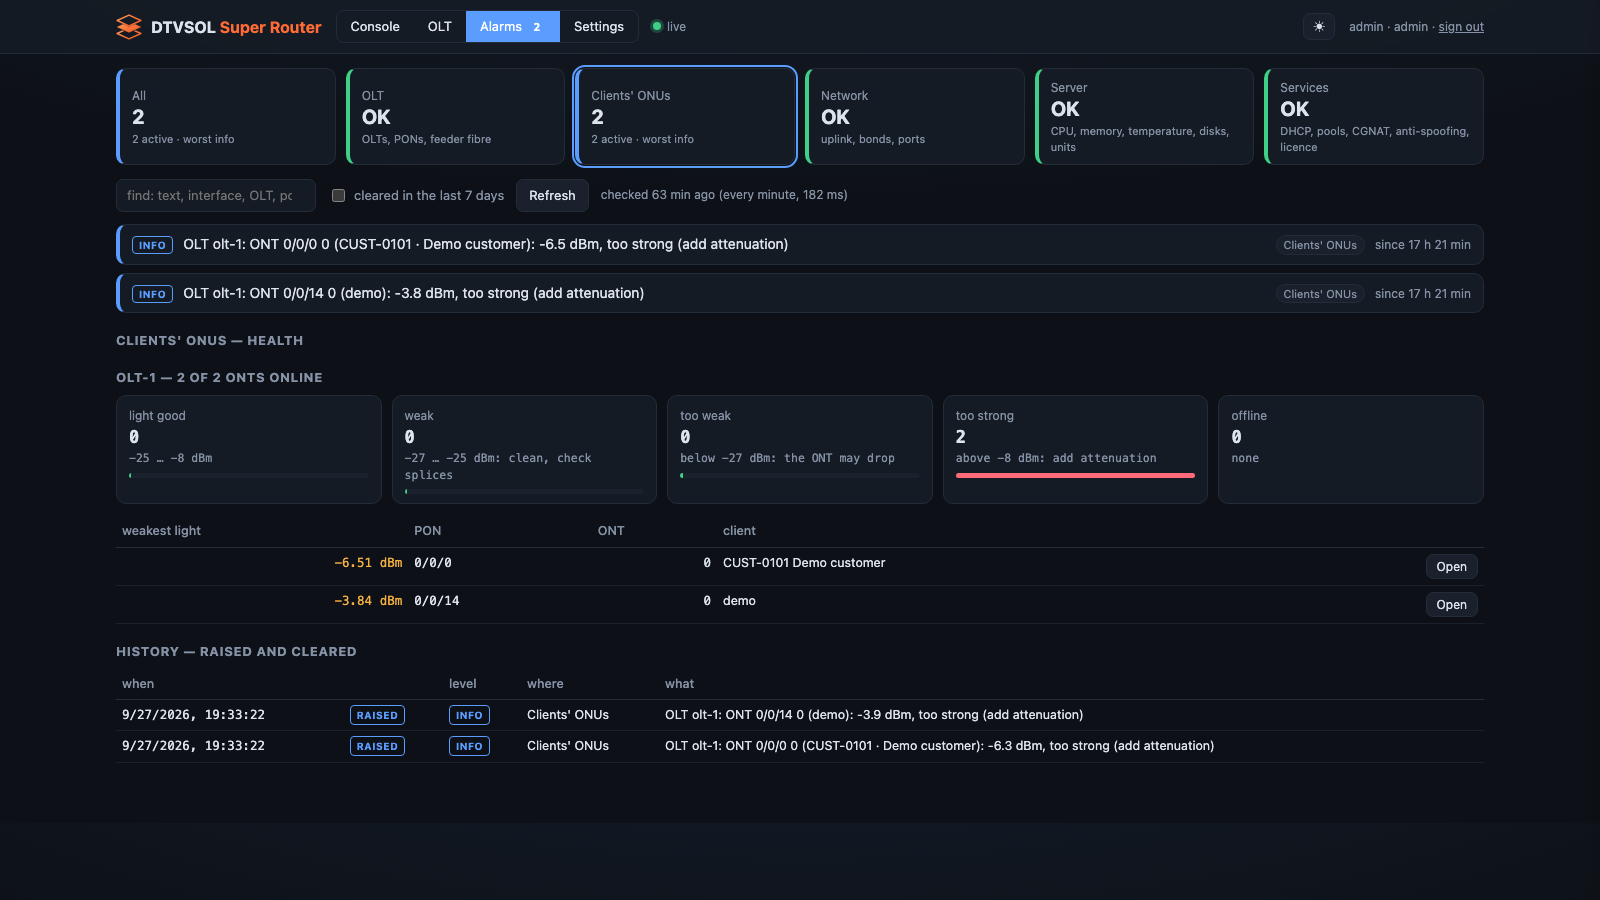
The clients’ ONUs
Online and why the others are not, the light of every ONT in bands, the weakest ones first.
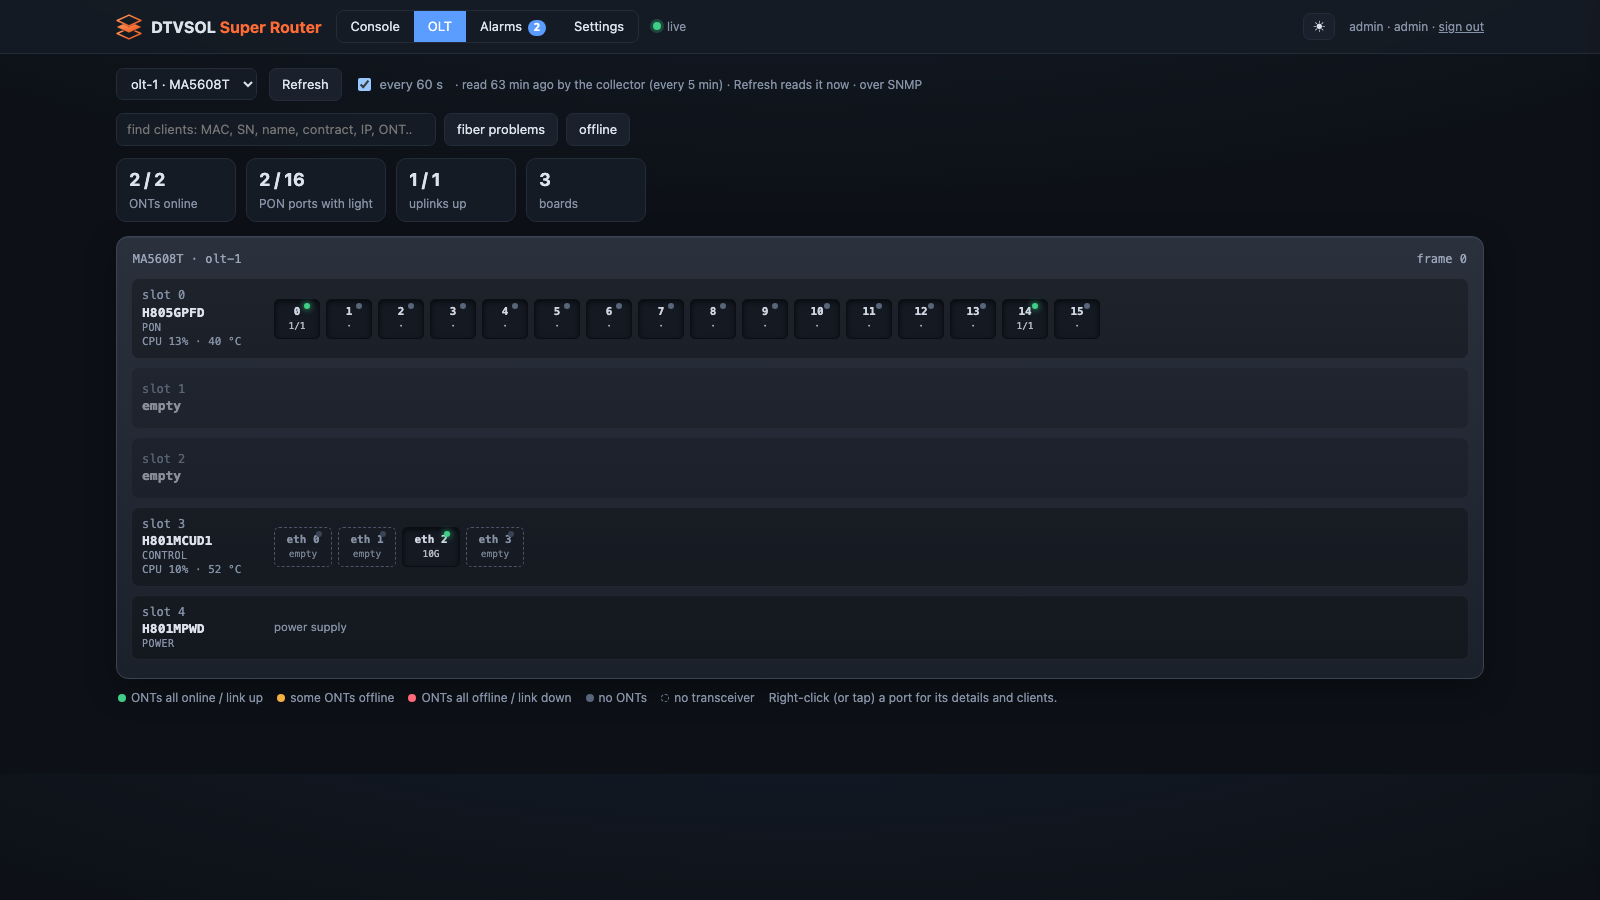
The OLT
Boards and PON ports as the OLT has them, from the collector — a click opens a port with its clients and their fiber history.
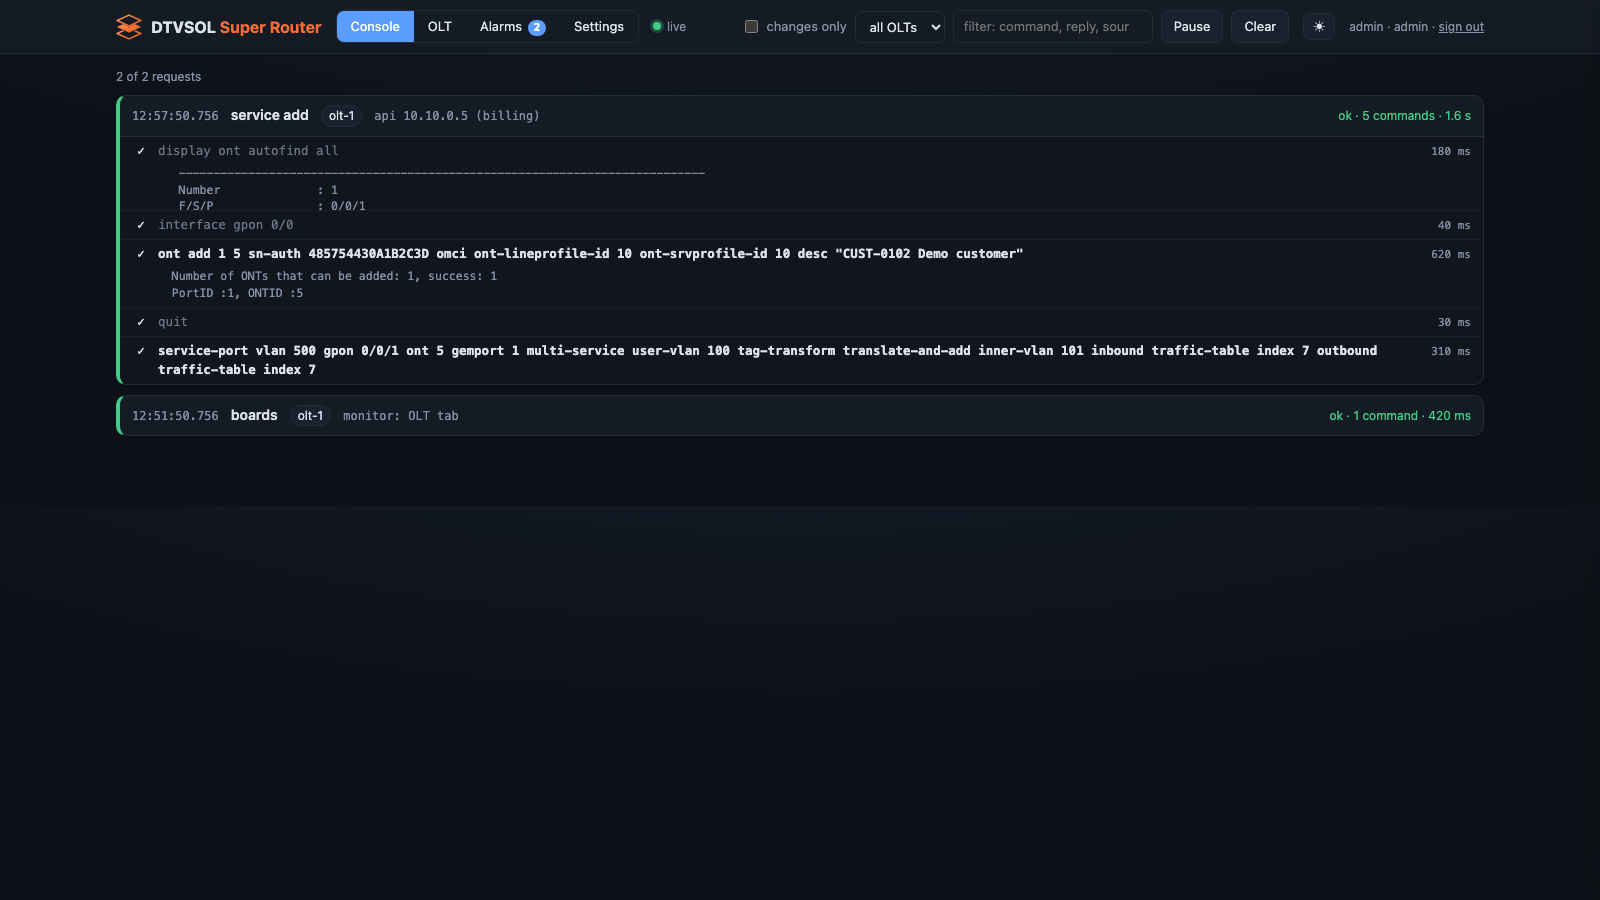
The live console
Every command the router sends to an OLT, and the reply, as it happens.
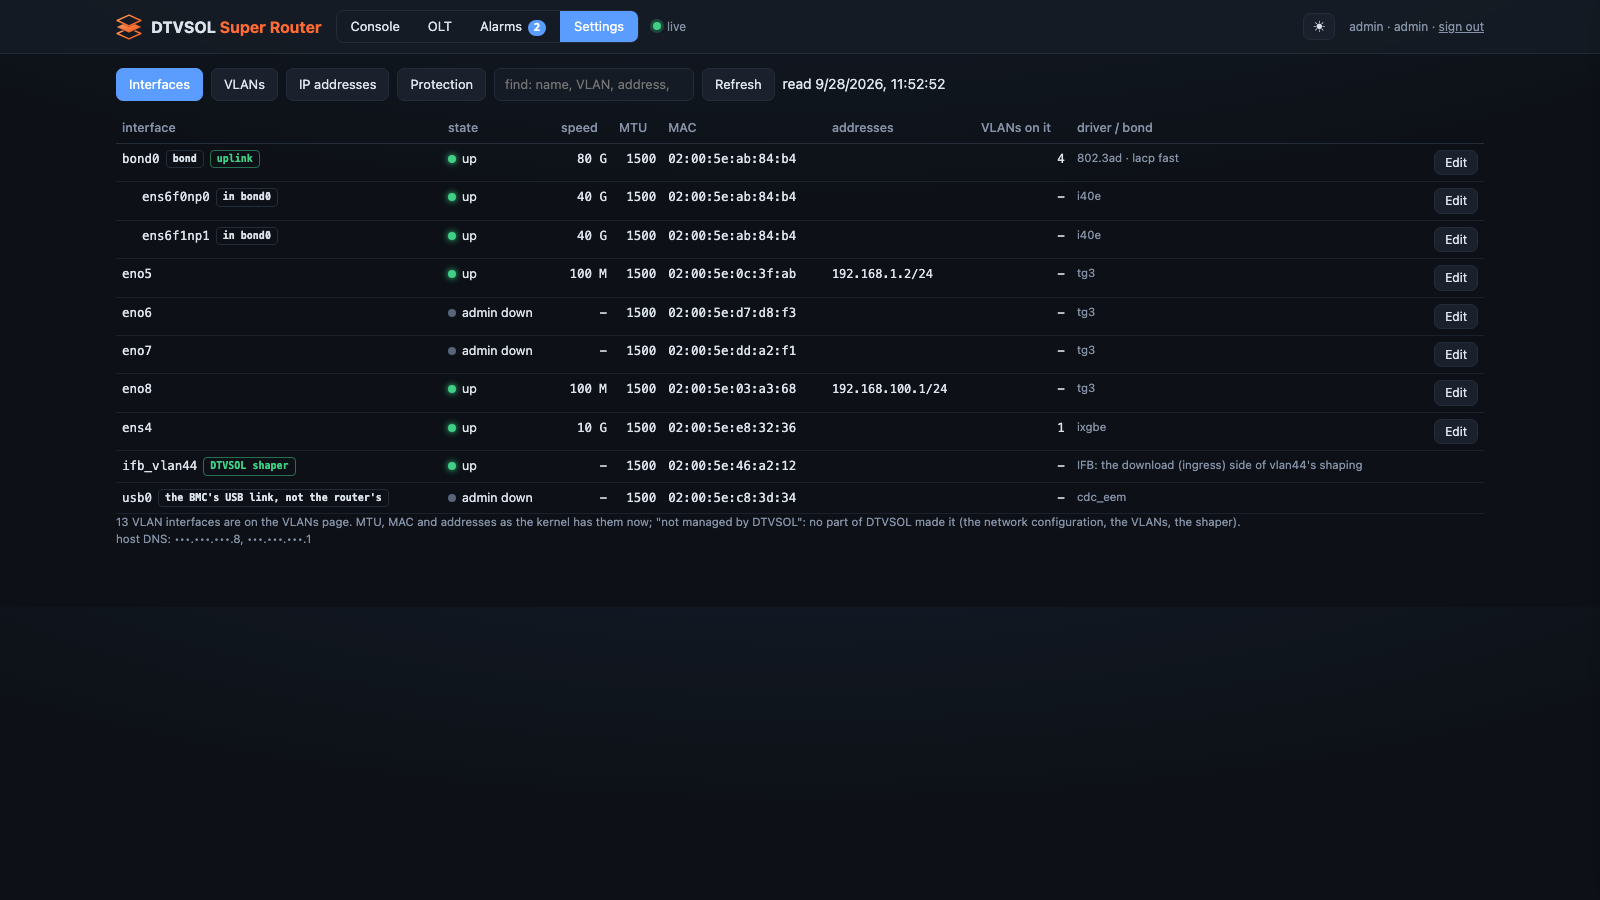
Interfaces
Ports and bonds as configured and as the kernel has them — edited, reviewed and applied with a 120 s safety net.
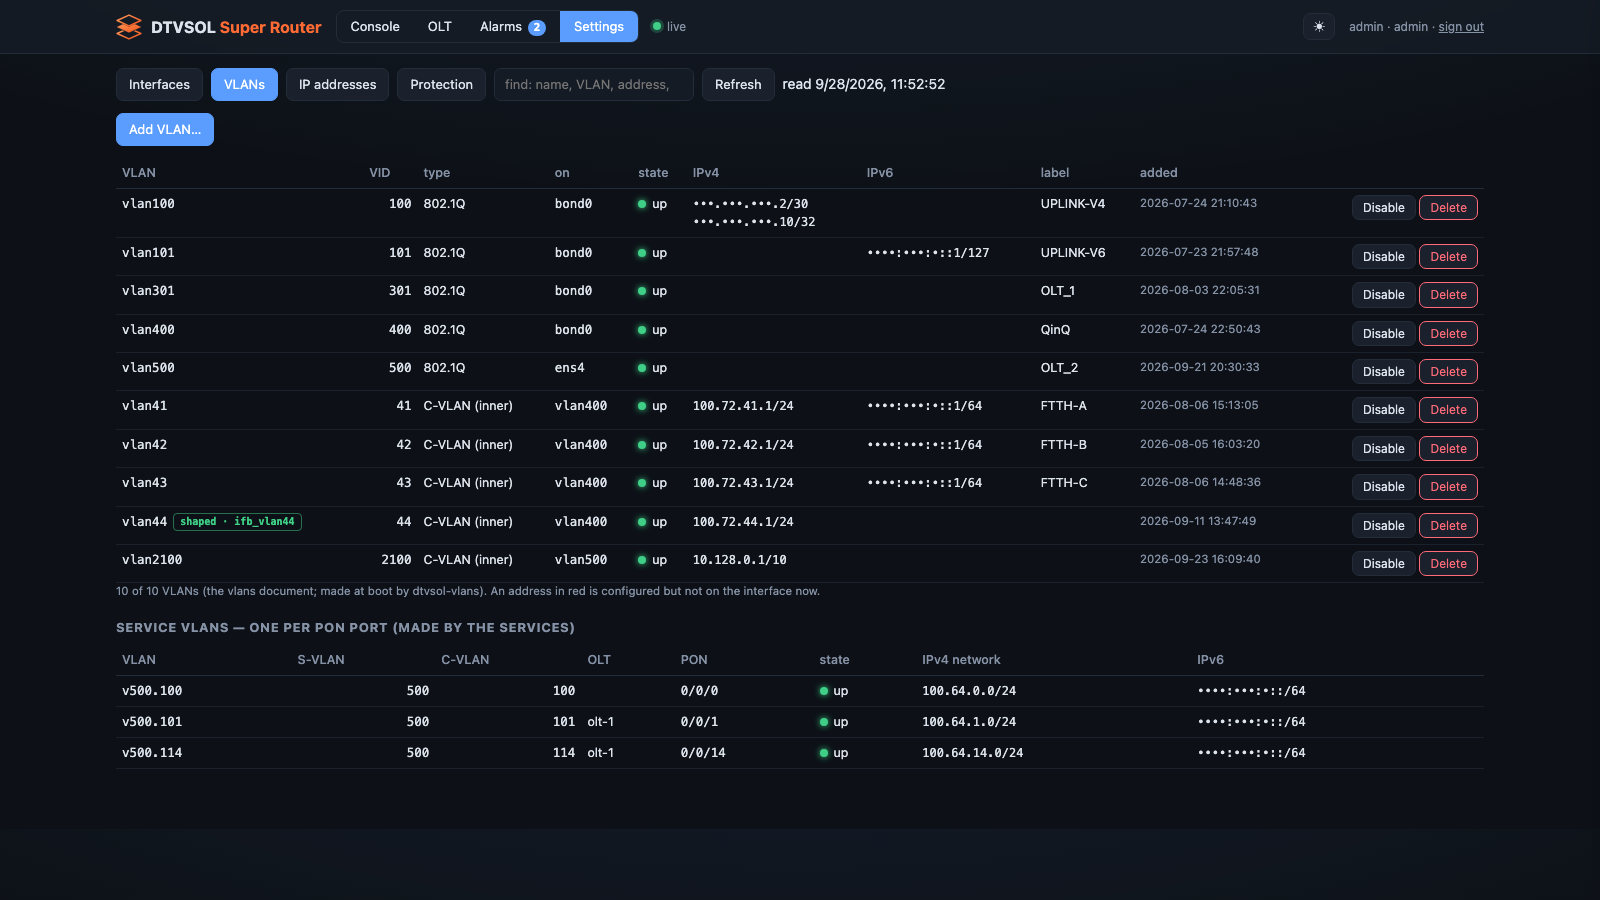
VLANs
Operator VLANs, QinQ and the service VLANs, one per PON port.
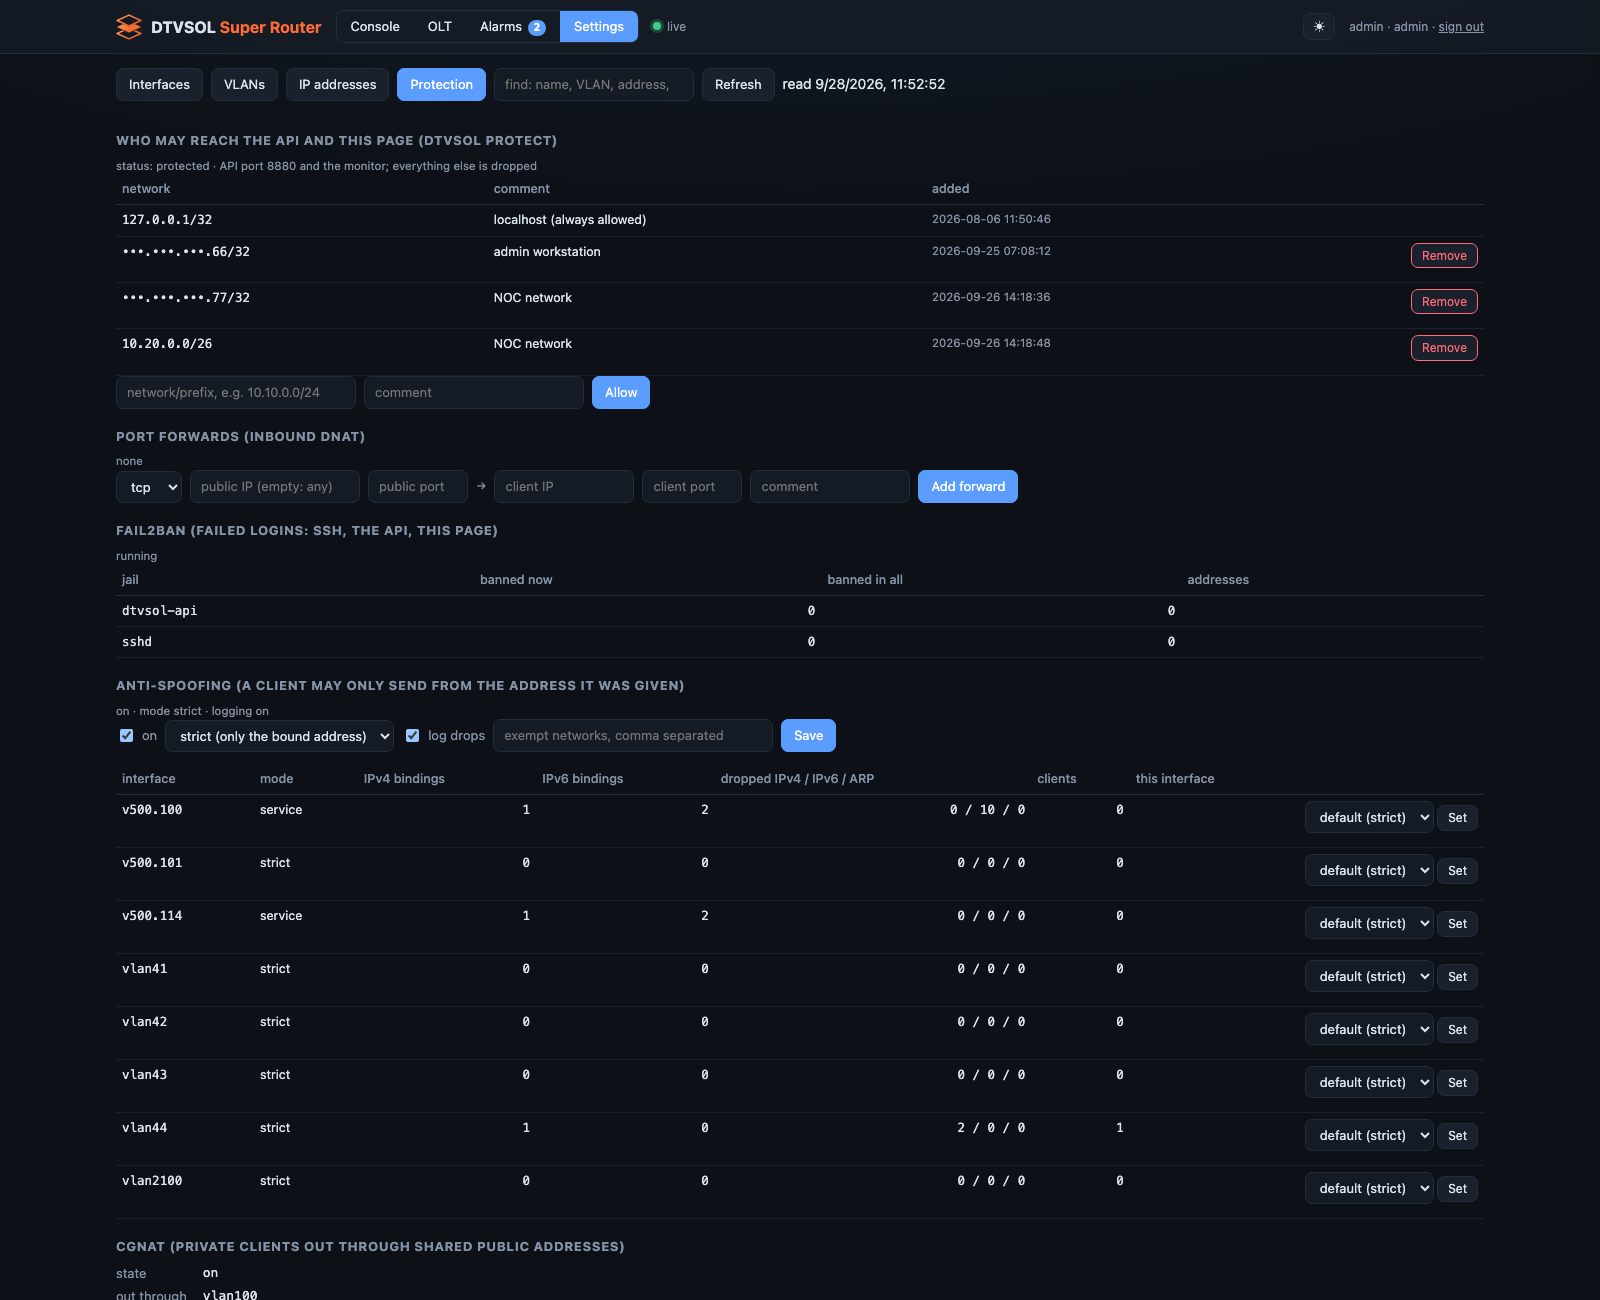
Protection
Who may reach the router, port forwards, fail2ban, anti-spoofing and CGNAT.
The API
Pick a call to see the request and a recorded answer. Your billing uses the same calls.